Misleading claim misuses US heat wave index to downplay worsening heat waves
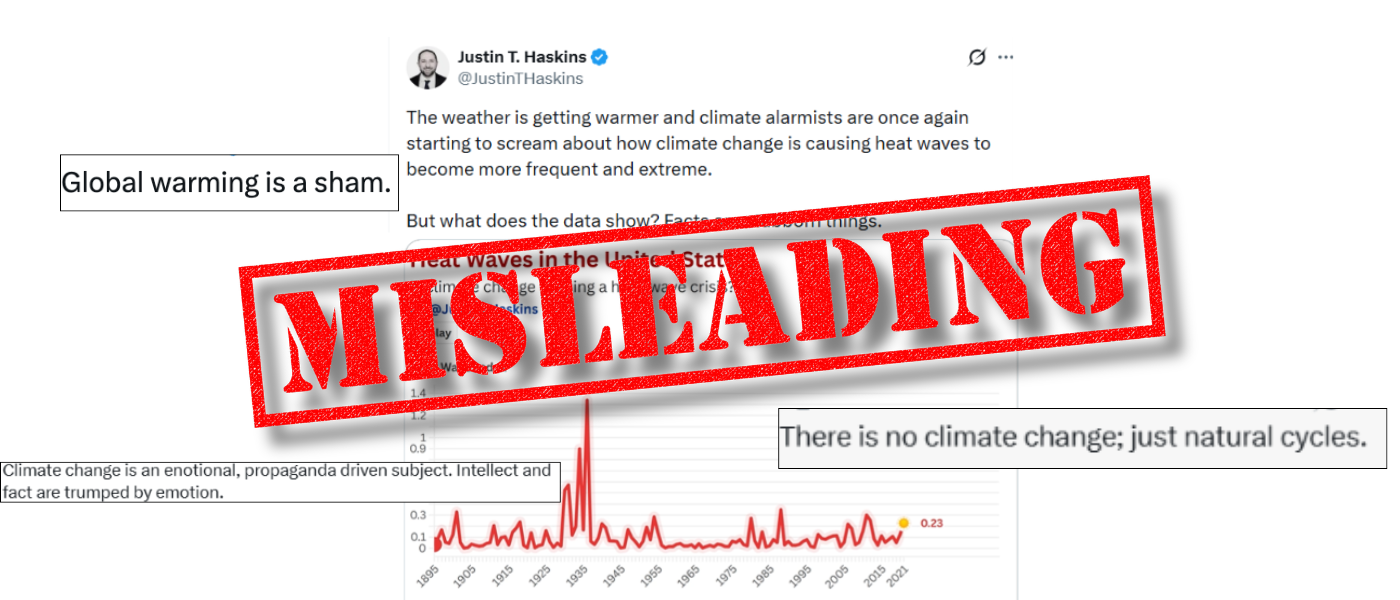
In late June, Justin Haskins, an author and commentator with more than 137,000 followers on X, posted an animated chart of the U.S. heat wave index, misleadingly suggesting data does not support the idea that “climate change is causing heat waves to become more frequent and extreme.”
The chart, which shows annual index values from 1895 to 2021, appears mostly flat over time, with values far below a spike in the 1930s.
While recent values are higher than the mid‑20th‑century lows, the 2021 index value of 0.23 is still well below the peak of about 1.34 recorded in the 1930s.
Haskins’ X post and the same claim on his Facebook together gained about 1,700 likes and 560 shares. Similar posts posts by other users discussing the chart also appeared on X.
However, those posts and commentaries are misleading. The interpretation ignores how the index is constructed, the uniqueness of the 1930s spike, and decades of evidence that heat waves have intensified in the United States and globally.
What the heat wave index actually shows
The data comes from the U.S. Environmental Protection Agency (EPA)’s climate change indicators.
Although the specific web page was removed as part of broader political and administrative changes to the agency’s climate web content under the Trump administration, the underlying datasets and technical documentation remain available.
Contrary to the implication that heat waves are not worsening, the EPA states that the index shows “a highly statistically significant linear trend since 1960” toward more heat wave activity.
Other figures on the same EPA page show increases in the frequency, duration, season length, and intensity of heat waves in large U.S. cities since the 1960s.
According to EPA documentation, the Annual U.S. Heat Wave Index is developed by climatologists at the National Oceanic and Atmospheric Administration (NOAA). The index measures “the frequency and spatial extent of extreme heat events” in the U.S. in a given year.
A heat wave in this index is defined as a period of at least four consecutive days with an average temperature above a threshold that would be expected only once in 10 years, based on historical data for that location. The index rises when heat waves occur more often or cover a larger area.
Professor Amos Tai from the Department of Earth and Environment Sciences at the Chinese University of Hong Kong told Annie Lab that extreme heat in the 1930s over the U.S. was a “regional manifestation of natural [climate] variability on an otherwise cooler global climate.”
He noted today’s global baseline is much warmer, and a single early-20th-century peak in one country does not contradict long-term global warming.
The Dust Bowl spike in the 1930s
The sharp peak in the index during the 1930s reflects the Dust Bowl, a period of severe drought and dust storms in the central U.S. roughly between 1930 and 1939, with a notable peak in 1936.
As meteorologist Matthew Cappucci explained in a Washington Post article in 2022, years of land mismanagement and soil degradation from unsustainable farming practices dried out the landscape, making it easier for temperatures to reach record highs.
Cappucci also said comparing the Dust Bowl with recent heat waves is like comparing apples to oranges because the Dust Bowl was a regional event on a cooler planet.
The article quoted Andrew Dessler, an atmospheric sciences professor at Texas A&M University, as saying that the heat in the 1930s affected only part of North America and was “mainly random climate variability” amplified by poor farming practices.
Tai similarly told Annie Lab that the Dust Bowl’s exceptional heat does not contradict global warming trends because climate change “concerns shifts in the overall probability distribution of extremes,” not single outlier events.
Why the long-term graph can look ‘flat’
The EPA notes that the heat wave index is “somewhat difficult to analyze” because large outliers in the 1930s and uncertainties in early data from fewer stations make the full 1895–2021 series noisier. When the entire record is fitted with a single trend line, the increase does not appear significant enough.
However, when analysts focus on data from about 1960 onwards, the EPA finds a highly statistically significant upward trend in heat wave activity.
Tai explained that decade-to-decade variability makes the full chart appear flat, but the post-1960 data shows a clear upward trend. Both Tai and the EPA said heat waves can be defined in different ways, and researchers use various indices.
Multiple datasets and methods still agree that heat waves have become more frequent and intense, both in the U.S. and globally, since the mid-20th century.
Related figures on US heat wave activity
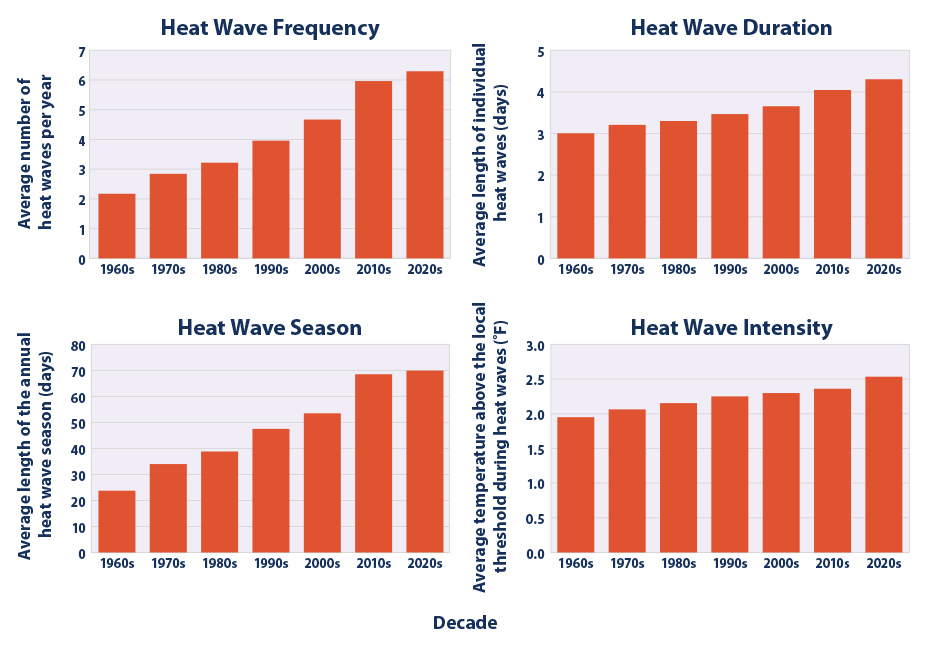
Other graphics on the same EPA indicator page, which are absent from the social media posts, show clear changes in heat waves.
NOAA data on the page indicates rising heat wave frequency, duration, season length, and intensity in 50 large U.S. metropolitan areas since the 1960s.
For example, the average number of heat waves per year increased from about two in the 1960s to around six in the 2010s and early 2020s in many cities.
Technical tables in the documentation also report statistically significant long‑term rates of change across multiple heat wave characteristics.

Heat waves and global climate change
Heat waves have intensified globally in recent decades, consistent with the rise in global temperatures.
This year, South Asia experienced severe heat in April and May, with many cities in India exceeding 46 degrees Celsius, according to a World Weather Attribution analysis.
The World Meteorological Organization has reported that many European countries recently broke national temperature records, with parts of Germany, Hungary, and Spain surpassing 40 degrees Celsius.
Tai said multiple extreme heat events this decade are virtually impossible without human-caused warming. “Climate change doesn’t create heatwaves out of thin air. It turns ordinary heatwaves into extraordinary ones,” he added.
The Intergovernmental Panel on Climate Change’s Sixth Assessment Report concludes that global surface temperature has increased by about 1.1 degrees Celsius above pre-industrial levels. The report finds that human-caused climate change has likely increased the frequency and intensity of many types of extremes, including heatwaves, heavy precipitation, droughts, and tropical cyclones.
These findings are based on extensive observations, physical understanding of the climate system, and attribution studies that compare real‑world events with simulations of a world without human greenhouse gas emissions.
Annie Lab contacted the EPA and Kenneth Kunkel, the researcher who developed the U.S. Annual Heat Wave Index. They have not responded at the time of publication.
Impact of worsening heat waves
A modeling study published in The Lancet Planetary Health estimated about 489,000 heat‑related excess deaths per year globally from 2000 to 2019, with more than half occurring in Asia.
This year, World Health Organization Director‑General Tedros Adhanom Ghebreyesus said on X (archived here) that more than 1,300 heat-related excess deaths have been recorded since June 21.
Extreme heat can harm human health directly and indirectly, and it also disrupts agriculture, ecosystems and infrastructure. Tai noted that yields of many major crops, such as maize, wheat, and soybeans, generally start to decline when temperatures exceed 30 degrees Celsius, and marine heat waves can cause coral bleaching and mass fish die-offs.
Heat can also deform roads, buckle rails, and strain power systems by increasing electricity demand while reducing cooling water available for thermoelectric plants.
Climate misinformation patterns
Fact-checks by USA Today, Climate Fact Checks, Reuters, AFP, and others have previously looked into similar misleading climate narratives that cherry-picked short-term weather, partial datasets, or misinterpreted scientific findings to suggest global warming is slowing or not occurring.
Climate change denier Justin Haskins is affiliated with the Heartland Institute, a Chicago-based conservative think tank that has long questioned climate science. In October 2021, PolitiFact fact-checked the Institute’s claim that U.S. wildfires burn far fewer acres today than in the early 20th century and rated it “Mostly False,” noting that it relied on flawed pre-1983 federal data that double-counted some fires and included intentional burns as wildfires.


